Ottawa Market Data, The Numbers
Prices ⬆️ & ⬇️
Residential Prices ⬇️ 16% from last year
Average Price: $708,968
Condominium Prices ⬇️12% from last year
Average Price: $410,927
approx 5% over January 2023
Supply Total Inventory – ⬆️ & ⬇️
February 2023 saw 2.74 months which is UP from February 2022 where we had less than one month however, its Down from January 2022
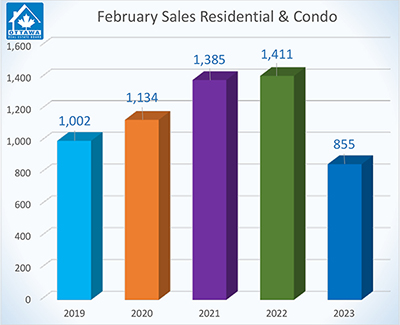
Demand Total # of Sales – ⬇️ 855 sales for the month of February.
OTTAWA, March 3, 2023 – Members of the Ottawa Real Estate Board (OREB) sold 855 residential properties in February through the Board’s Multiple Listing Service® (MLS®) System, compared with 1,411 in February 2022, a decrease of 39%. February’s sales included 633 in the freehold-property class, down 42% from a year ago, and 222 in the condominium-property category, a decrease of 31% from February 2022. The five-year average for total unit sales in February is 1,157.
“We’re going to see declines in transactions and prices when we compare current figures to last February — the height of the pandemic resale market activity,” says Ottawa Real Estate Board’s President Ken Dekker. “On the other hand, with the Bank of Canada holding interest rates steady, prospective buyers have more budget certainty to work with as we head into the spring market.”
 |
By the Numbers – Average Prices*:
- The average sale price for a freehold-class property in February was $708,968, a decrease of 15% from 2022. However, it marks a 5% increase over January 2023.
- The average sale price for a condominium-class property was $410,927, decreasing 12% from a year ago.
- With year-to-date average sale prices at $695,086 for freeholds and $411,449 for condos, these values represent a 14% decrease over 2022 for freehold-class properties and a 10% decrease for condominium-class properties.
“The average price increase for freeholds over January could be an indicator that buyers have normalized to the current interest rates. And perhaps, it’s a glimmer of more activity to come in the months ahead.”
By the Numbers – Inventory & New Listings:
- Months of Inventory for the freehold-class properties has increased to 2.8 months from 0.7 months in February 2022.
- Months of Inventory for condominium-class properties has increased to 2.5 months from 0.7 months in February 2022.
- February’s new listings (1,366) were 22% lower than February 2022 (1,762) and up 3% from January 2023 (1,323). The 5-year average for new listings in February is 1,632.
- Days on market (DOM) for freeholds decreased from 43 to 37 days and 47 to 43 days for condos compared to last month.
“A decrease in the days on market, paired with fewer new listings entering the market, is good news for sellers,” says Dekker. “However, if that trend continues to impact our supply stock and we don’t get more inventory, our otherwise balanced market could swing back into seller’s territory — but it’s too early to predict.”
“The best advice for sellers and buyers in today’s market is to pay close attention to the comparison and competition insights only a REALTOR® can offer. Ottawa is made up of many micro-markets, and neighbourhood-level data is vital to standing out and closing deals.”
REALTORS® also help with finding rentals and vetting potential tenants. Since the beginning of the year, OREB Members have assisted clients with renting 995 properties compared to 800 last year at this time, an increase of 24%.
* OREB cautions that the average sale price can be useful in establishing trends over time but should not be used as an indicator that specific properties have increased or decreased in value. The calculation of the average sale price is based on the total dollar volume of all properties sold. Price will vary from neighbourhood to neighbourhood


